With Google’s Universal Analytics soon to be deprecated and replaced by Google Analytics 4 (GA4), many website owners are beginning the adapt their workflows to GA4. Since GA4 is structurally different than its predecessor, its reports, measurements, and visualized metrics vary from Universal Analytics, making a one-to-one transition impossible. However, due to popular demand, one metric from Universal Analytics has returned: Bounce Rate.

What is Bounce Rate?
Bounce rate is a metric that businesses can use to visualize how their pages (and site as a whole) are doing. Bounce rate is the total number of single page sessions over the total number of entrances on the page. Simply put, bounce rate is the number of times users come to your page and leave without taking any important action. In this case, we want users to click on our links, buttons, or navigation bars to explore our content. Not clicking on anything results as a bounce. This metric is a popular way to identify what pages are not engaging enough for users and need improved.
Why did Google get rid of Bounce Rate?
While bounce rate is a useful tool, it doesn’t paint a completely accurate picture of our websites. By assuming that a user who does not click on anything after they arrive to our site as a bounce, we are saying that those users were not engaged with our content. Bounce rate does not take into account the amount of time a user spends on our landing page before leaving. For sites that have long, content filled landing pages, a user could have been exploring the landing page for 5 minutes before leaving. Spending 5 minutes on our page clearly shows that the user was interested by our content, but bounce rate does not consider that scenario.
To overcome this limitation, Google’s GA4 replaced bounce rate with a new metric: Engaged session. Engage session allows us to track when a user was engaged with more granularity but taking into account both time and actions. An engaged session is a session that results in an action (a click) OR lasts more than 10 seconds. By taking time into consideration, engaged sessions more accurately identify the amount of users who are attracted to our content.
However, changing to new metrics mean that businesses have to change their analytics strategy. While changes to the way we use Google analytics is inevitable, it was too sudden for some users, resulting in dissatisfaction. In July of 2022, due to popular demand, Google added bounce rate to GA4 as an optional metric.
How do I add Bounce Rate & Engaged Sessions to my reports?
Both bounce rate and engaged sessions are metrics that will need to be manually selected in order to be viewed. Here is how you can get start tracking these metrics in your GA4 account:
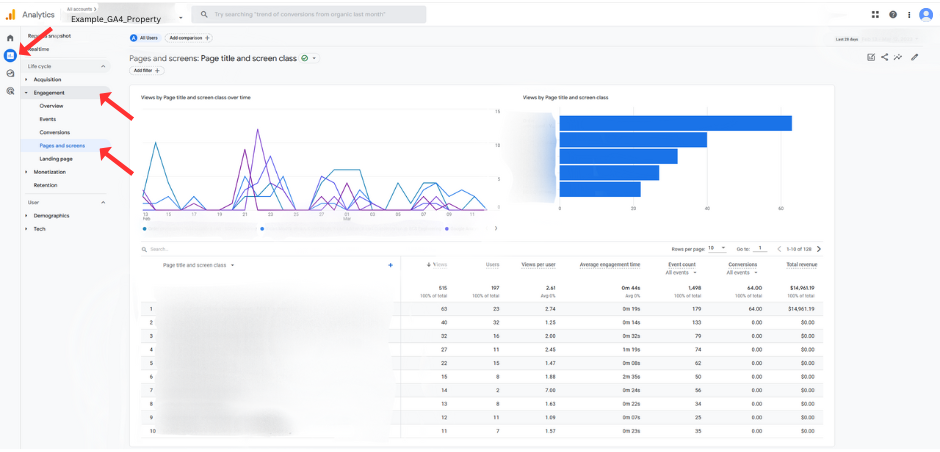
First, go to the Engagement tab of your Reports section, followed by the Pages and Screens tab.
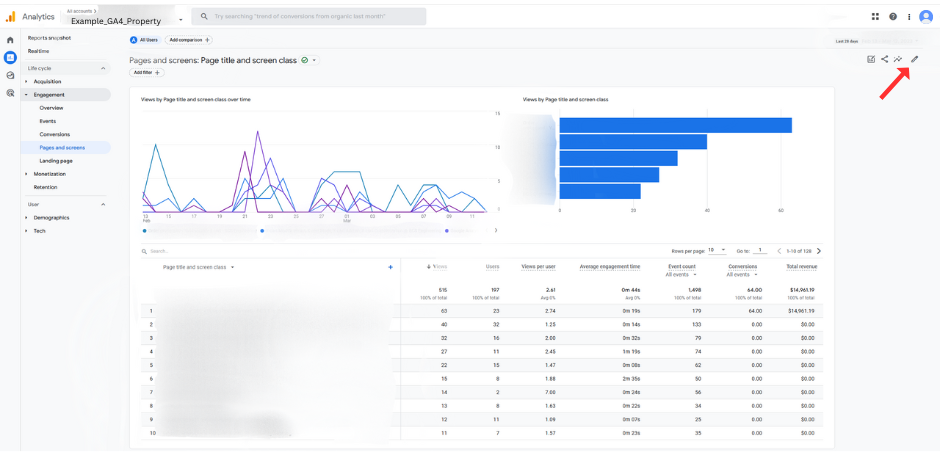
Next, click the pencil icon in the right-hand corner. If you do not see the pencil icon, you may not have permission to edit your GA4 reports.
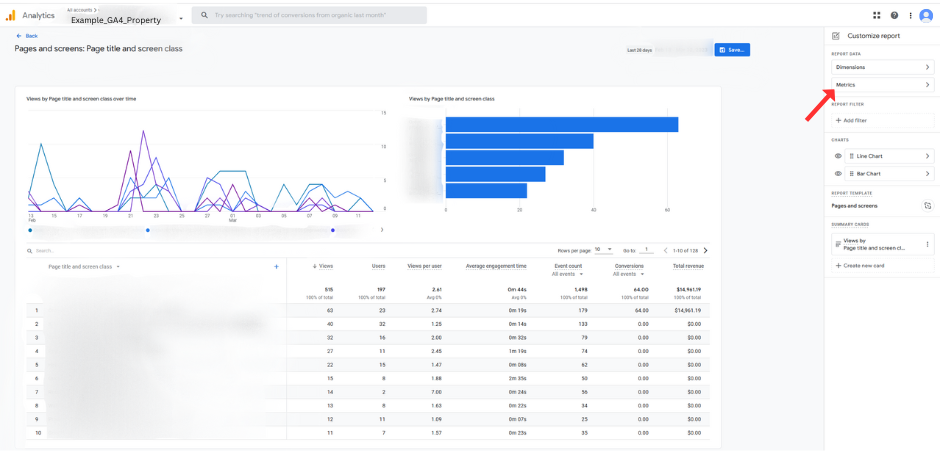
Click on the Metrics tab.
To add our desired metrics, click Add Metric.
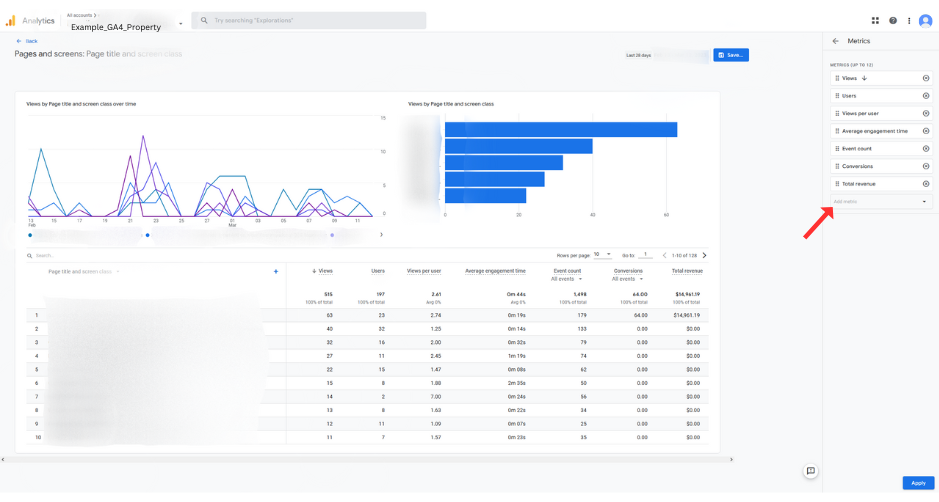
To add Engaged Session to our report, simply begin to type out “engaged session” and you will see the metric appear. Click on it to add it to the list.
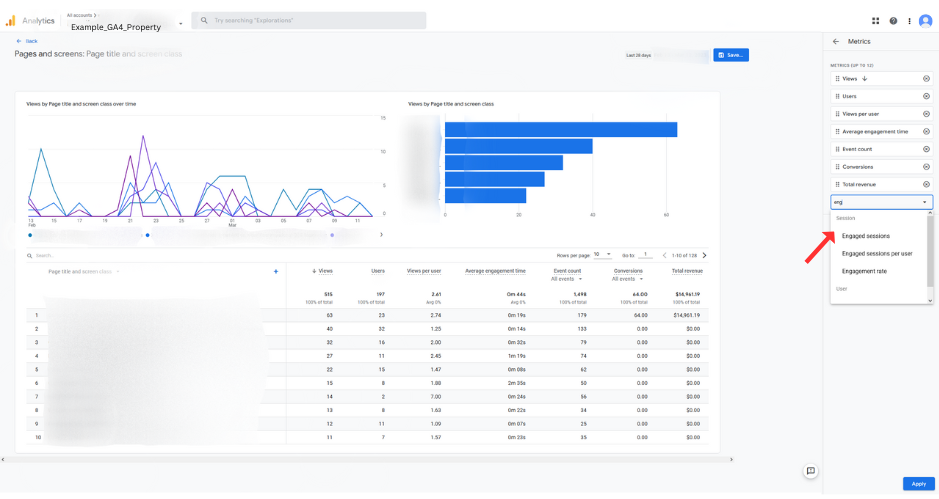
To add Bounce Rate to our report, we type out “bounce rate” and you will see the metric pop up. Click on it to add it to the list.
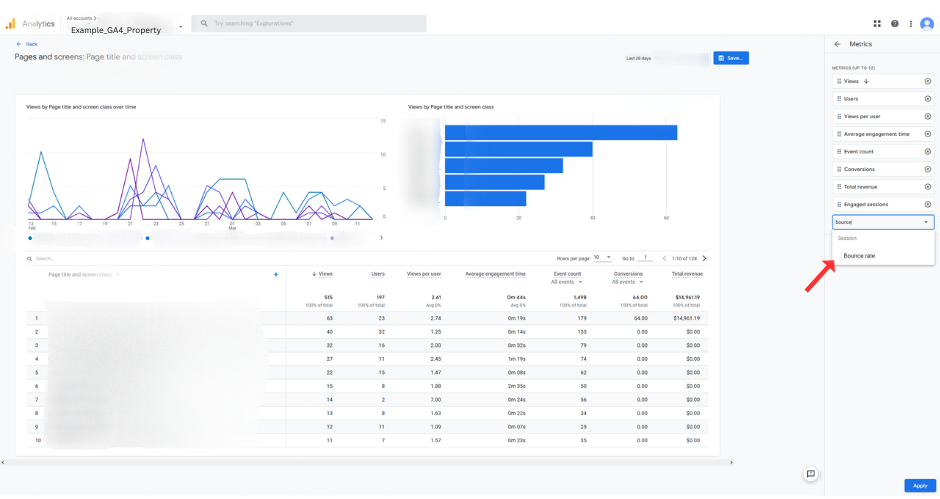
Once you have added your desired metrics, click Apply in the bottom righthand corner.
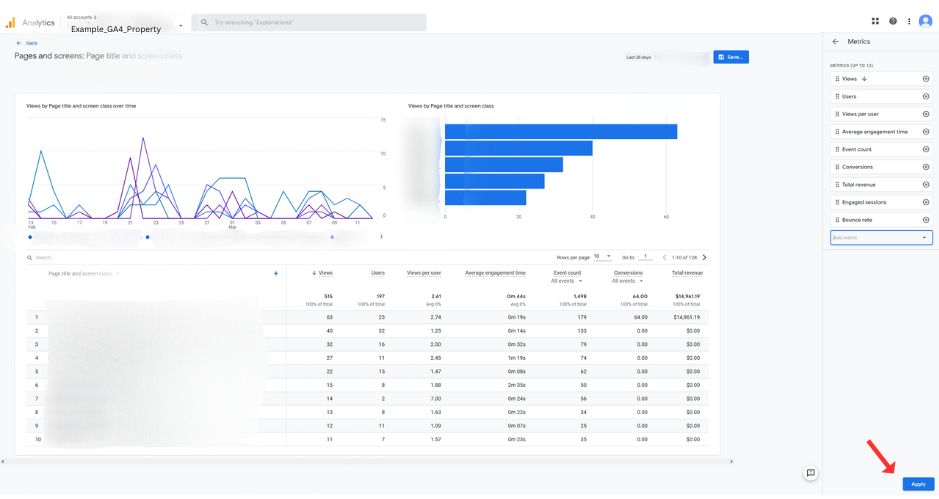
Upon applying, you will see your new metrics included in your report. If you are content with them, click Save and then Save changes to current report. Confirm your decision.
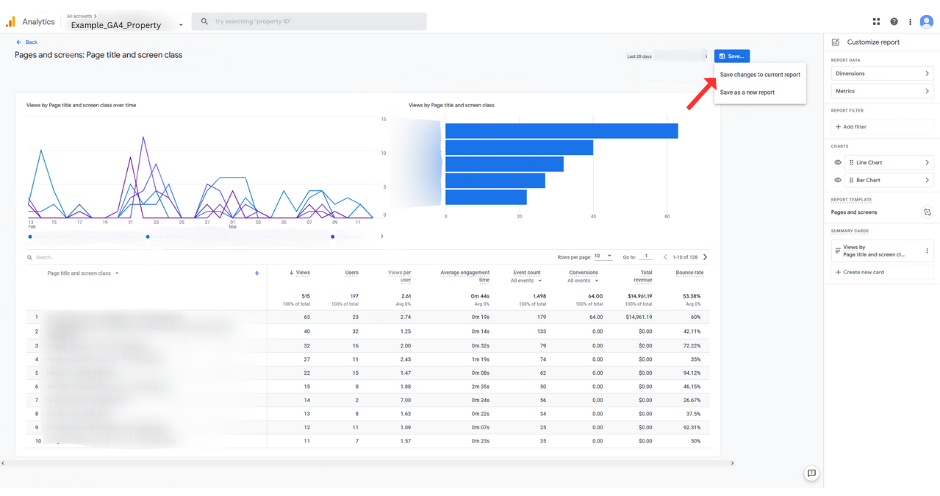
Congrats! Once saved, you have successfully added bounce rate and engaged sessions to your reports!
Want to Learn More about GA4?
Whether we like it or not, Google Analytics 4 is here to stay. Check out our blog to learn more about GA4! Want to get started on setting up your GA4 property but don’t know where to start? Check out our free GA4 Crash Course to jump start your GA4 journey!
