In our previous blog, we introduced Google Search Console, a hub of tools that aim to help you improve your website as seen by Google. Last time, we focused on tools that optimized your site for use in Google Search, but Google Search Console has other powerful tools to explore. One such tool allows us to take a deeper look into how your page is being experienced by users. The first impressions of your site can be key to turning visitors into customers. Measuring how users are experiencing your pages can help you make your pages more attractive and friendly to both new and old users. Google measures website experience on a few factors, the most important aspect being Core Web Vitals.

Google’s Core Web Vitals
If Core Web Vitals sound like a familiar term, you may recall our past blog where we defined what Core Web Vitals are and some tools that we can use to measure them. Core Web Vitals are composed of three types of measurements that explore how fast your page is and feels.

Above are the three Core Web Vitals that Google focuses on. As defined in the photo, these vitals are measured by loading, interactivity, and visual stability. Let’s define these vitals by the questions they ask us:
- Largest Contentful Paint (LCP): How fast does the largest piece of content on my site take to appear?
- First Input Delay (FID): How long does it take for my site to respond to a click from a user?
- Cumulative Layout Shift (CLS): How stable is my site when loading?
Determining the status of these vitals on your site can be done by comparing them to the ideal metrics as defined by Google. For LCP, the ideal time it should take to load the largest element on your page is 2.5 second or less. For FID, a response from your page after user input should occur in 100 milliseconds or less. Finally, for CLS, defined by how often elements shift around while your page is loading, should be 0.1 or less.
Page Experience & Core Web Vitals in Google Search Console
The user experience of your website can be measured with a variety of online tools that can offer both broad and specific feedback. If you are looking for an overview of how your site is doing, Google Search Console can help!
On the home screen of your Google Search Console account, on the left-hand side, is a tab called “Experience.” Under that tab should be “Page Experience” and “Core Web Vitals.”

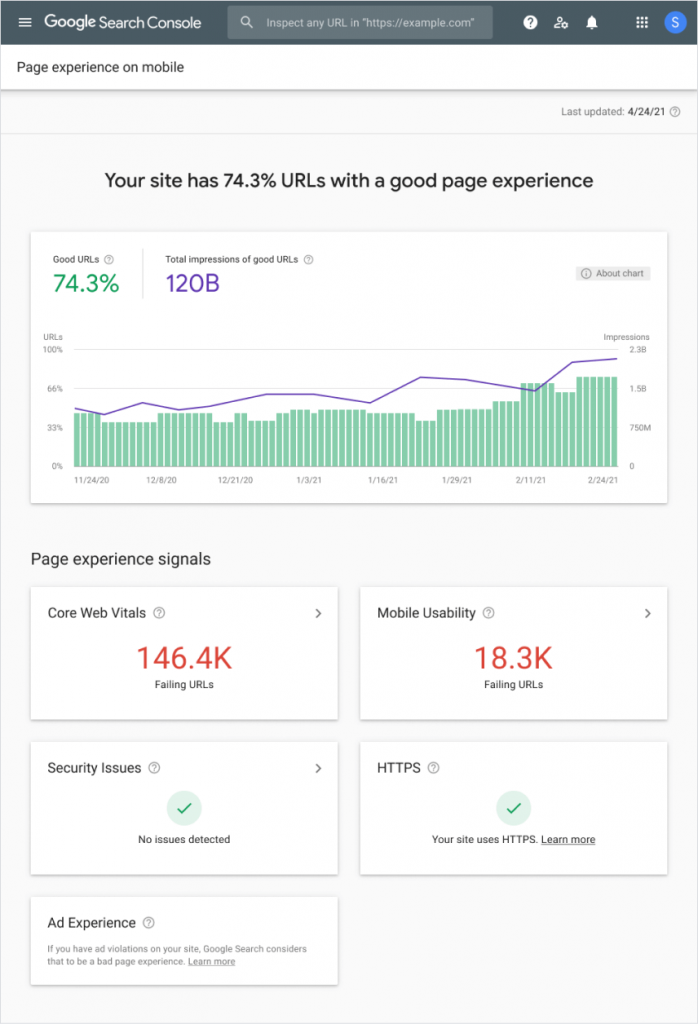
Clicking the “Page Experience” tab offers you an overview of how well your site is doing and breaks down how your site is being ranked. In “Page experience signals”, we can see that Google is not only looking at Core Web Vitals, but also at how well your site adapts over to mobile. The security of your site is also considered. Let’s look at what things we can learn about the Core Web Vitals of our sites.

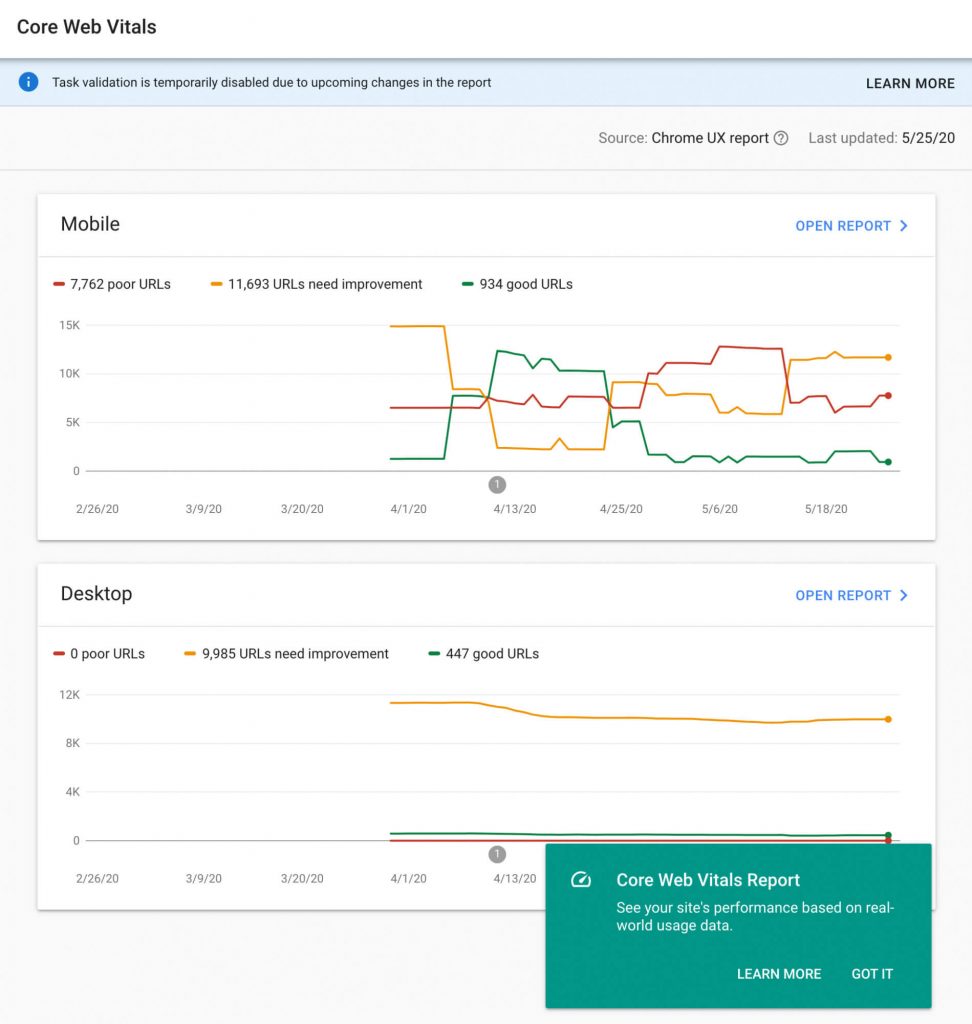
Clicking on “Core Web Vitals” will bring you to the screen above. This report shows us how well your site is doing over time, dividing its findings between Desktop experience and Mobile experience. The graph focuses on your site’s ranking. Green notes pages that are good in comparison to Google’s ideal metrics. Yellow are pages that could use some work and red are pages that may need immediate attention.

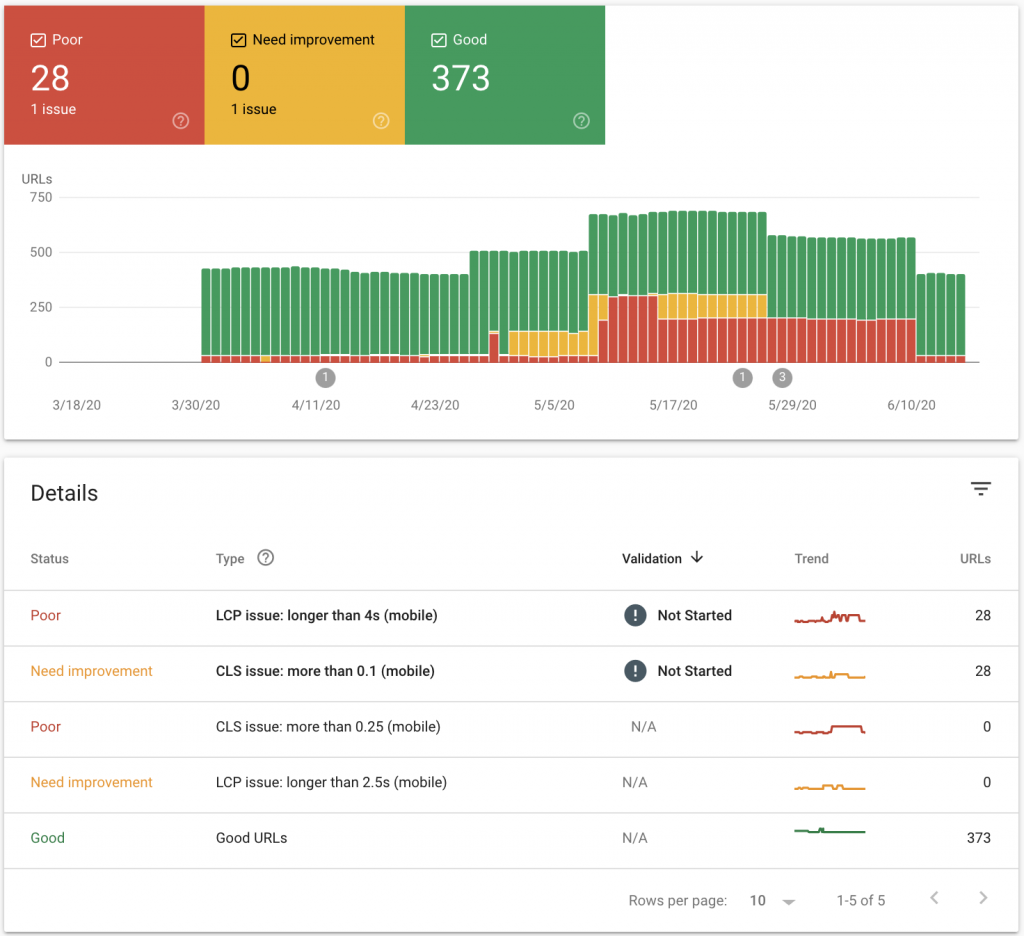
Clicking on “Reports” will bring you to a more detailed look at what is looked at and what needs work. In the example above, we can see that issues marked in yellow and red are tagged with the that vital is being judged. This allows us to identify which URLs need work and in what aspects, offering us both direction and validation. As you fix pages marked as problematic in Google Search Console, you can see your site improve as those pages go from being ranked “Poor” to “Good.”
Improving the Experience of my Website
Using tools like Google Search Console can offer avenues for improvement, but if you want further help with your site, BCSE is always here for you! Carrie’s upcoming course “The Converting Website” will also dive deeper into improving your site experience. Join the waitlist today to stay up to date about the course’s release!
